


Dec 24 , 2022
By Chris Bradley , Marc Canal Noguer
Until the COVID-19 pandemic, humanity was making great strides in extending lives and increasing economic prosperity. It is critical that we return to that trajectory as the global economy recovers. New research, which examines progress at a granular level, can help us get there.
Typically, human progress is assessed at a country level.
On average, the 178 countries where data are readily available have an area of 700,000Sqm, populations of some 40 million people, and produce around 700 billion dollars in GDP. But there are vast differences across and within countries, and the effectiveness of efforts to enhance economic prosperity and human well-being depends on understanding these differences.
That is why our new report, "Pixels of Progress: A Granular Look at Human Development Around the World", paints a picture that is 230 times more detailed than a country-level perspective. Using night-time luminosity and other cutting-edge techniques to gather and analyze data, we examine population patterns, economic performance, and changes in life expectancy from 2000 to 2019 across more than 40,000 microregions, each averaging 3,000Sqm in area, 180,000 people, and three billion dollars in GDP.
This approach revealed, for example, that in 2019, almost half of the world’s population enjoyed living standards that, just 20 years earlier, had been attained by only 21pc of humanity (largely in OECD countries).
In 2000, 12 microregions along China’s coast – with populations of 71 million – boasted life expectancies of more than 72.5 years and GDP exceeding 8,300 dollars per capita, putting them in the top 30pc globally for both of these metrics. By 2019, 86pc of China’s population – 1.2 billion people – lived in a microregion with living standards exceeding those thresholds.
Beyond China, microregions containing 920 million people spread across 75 countries crossed the same threshold.
Similar gains were made at the other end of the spectrum. In 2000, more than one billion people resided in microregions with the lowest living standards. By 2019, the figure had dropped to just over 400 million people, despite population growth. India in 2000 accounted for 43pc of microregions where longevity was less than 65.6 years and income was lower than 2,400 dollars (the bottom 30pc globally); in 2019, it no longer had a single microregion in that category.
Overall, our granular approach shows that living standards declined only rarely and in places often identifiable only through a microregional lens. Country averages obscure differences in microregional realities: using regression analysis, we found that a country’s GDP per capita growth rate explains only about 20pc of the variation in growth rates in its microregions. In other words, economic progress is primarily explained locally.
For example, our analysis tells a more nuanced story in places where a country-level view showed falling GDP per capita. A country-level analysis shows that 191 million people in 20 countries experienced negative income growth from 2000 to 2019. But as we zoom in, we can see exactly where GDP per capita fell: in 6,300 microregions that are home to three times as many people – 574 million – in 100 countries. For 80pc of these people, income losses can be explained not by overall economic decline but rather by rapid population growth.
Then there are the microregions that have made particularly rapid progress.
Consider Dibër, a microregion tucked away in the Albanian Alps. Dibër’s economy remains highly agrarian, but since Albania joined NATO in 2009, the local authorities have been working to revive its once-thriving tourism sector – catering to affluent European travellers visiting the Peshkopi thermal baths – with the help of international agencies.
During the period we studied, the number of health tourists rose steadily as accommodations increased, while glacial lakes and old-growth forests attracted hikers and trekkers. Such developments may have helped to boost health and incomes in Dibër, where GDP per capita more than tripled – from 3,300 dollars to 10,200 dollars – between 2000 and 2019, and average life expectancy rose from 74.1 to 78.3 years.
Dibër’s experience represents a broader trend: income and longevity have grown faster in microregions that started out further behind, narrowing global gaps in health and prosperity. In 2000, the bottom five percent of the world’s population lived in microregions where life expectancy was less than 49.7 years, and the top five percent could expect to live over 30 years longer (more than 79.5 years). By 2019, that gap had narrowed to 23 years.
The pandemic interrupted – and even reversed – the progress we examined, but it did not extinguish the potential for further gains. With a more granular understanding of how past progress unfolded – one that informs, for example, how we deploy resources – we can put ourselves on a path toward fulfilling that potential. We may even be able to chart a faster, clearer, and more efficient course.
PUBLISHED ON
Dec 24,2022 [ VOL
23 , NO
1182]

Fortune News | Mar 16,2019

Fortune News | Jan 23,2021
Fortune News | May 23,2020
Fortune News | Nov 27,2022
Fortune News | Apr 30,2021

In-Picture | Apr 19,2025

Fortune News | Mar 09,2019

Fortune News | Oct 27,2024
Radar | Jun 07,2020

View From Arada | Oct 01,2022

My Opinion | 131451 Views | Aug 14,2021
My Opinion | 127803 Views | Aug 21,2021
My Opinion | 125783 Views | Sep 10,2021
My Opinion | 123419 Views | Aug 07,2021


Dec 22 , 2024 . By TIZITA SHEWAFERAW
Charged with transforming colossal state-owned enterprises into modern and competitiv...
Aug 18 , 2024 . By AKSAH ITALO
Although predictable Yonas Zerihun's job in the ride-hailing service is not immune to...

Jul 28 , 2024 . By TIZITA SHEWAFERAW
Unhabitual, perhaps too many, Samuel Gebreyohannes, 38, used to occasionally enjoy a couple of beers at breakfast. However, he recently swit...

Jul 13 , 2024 . By AKSAH ITALO
Investors who rely on tractors, trucks, and field vehicles for commuting, transporting commodities, and f...
Jun 28 , 2025
Meseret Damtie, the assertive auditor general, has never been shy about naming names...

Jun 21 , 2025
A well-worn adage says, “Budget is not destiny, but it is direction.” Examining t...
Jun 14 , 2025
Yet again, the Horn of Africa is bracing for trouble. A region already frayed by wars...

Jun 7 , 2025
Few promises shine brighter in Addis Abeba than the pledge of a roof for every family...
Jun 29 , 2025
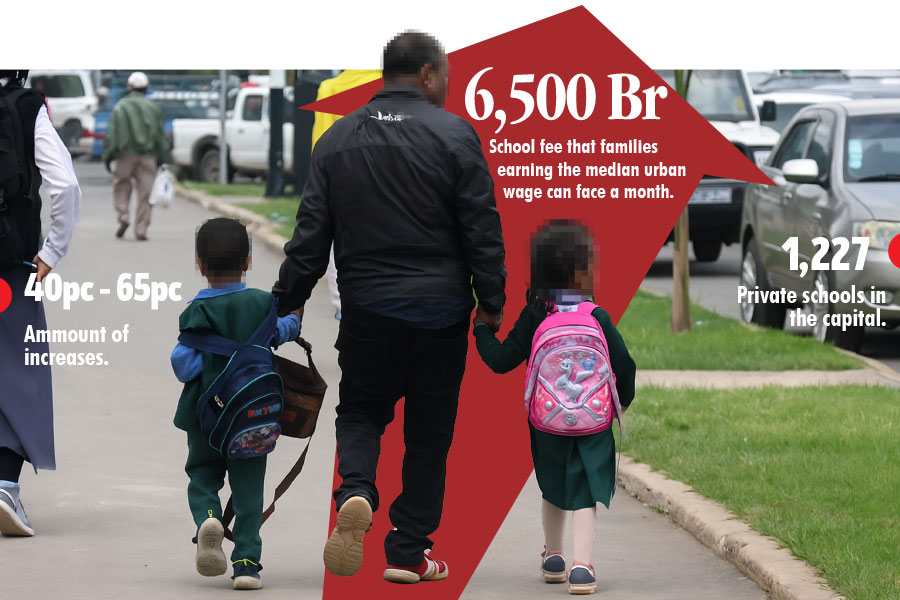
Addis Abeba's first rains have coincided with a sweeping rise in private school tuition, prompting the city's education...
Jun 29 , 2025 . By BEZAWIT HULUAGER
Central Bank Governor Mamo Mihretu claimed a bold reconfiguration of monetary policy...
Jun 29 , 2025 . By BEZAWIT HULUAGER
The federal government is betting on a sweeping overhaul of the driver licensing regi...

Jun 29 , 2025 . By NAHOM AYELE
Gadaa Bank has listed 1.2 million shares on the Ethiopian Securities Exchange (ESX),...


 Loading your updates...